
European body reports fifth-warmest January on record
Data source: ERA5. Image courtesy C3S/ECMWF
January 2026 was the fifth warmest on record and saw contrasting temperature extremes in the Northern and Southern Hemispheres, according to the Copernicus Climate Change Service (C3S), implemented by the European Centre for Medium-Range Weather Forecasts (ECMWF). C3S also recorded the month as being 1.47 degrees C above pre-industrial temperatures.
Samantha Burgess, Strategic Lead for Climate, ECMWF, said: “January 2026 delivered a stark reminder that the climate system can sometimes simultaneously deliver very cold weather in one region and extreme heat in another. While human activities continue to drive long-term warming, these recent events highlight that resilience and adaptation to increasing extremes are key to prepare society for heightened climate risk in the future.”
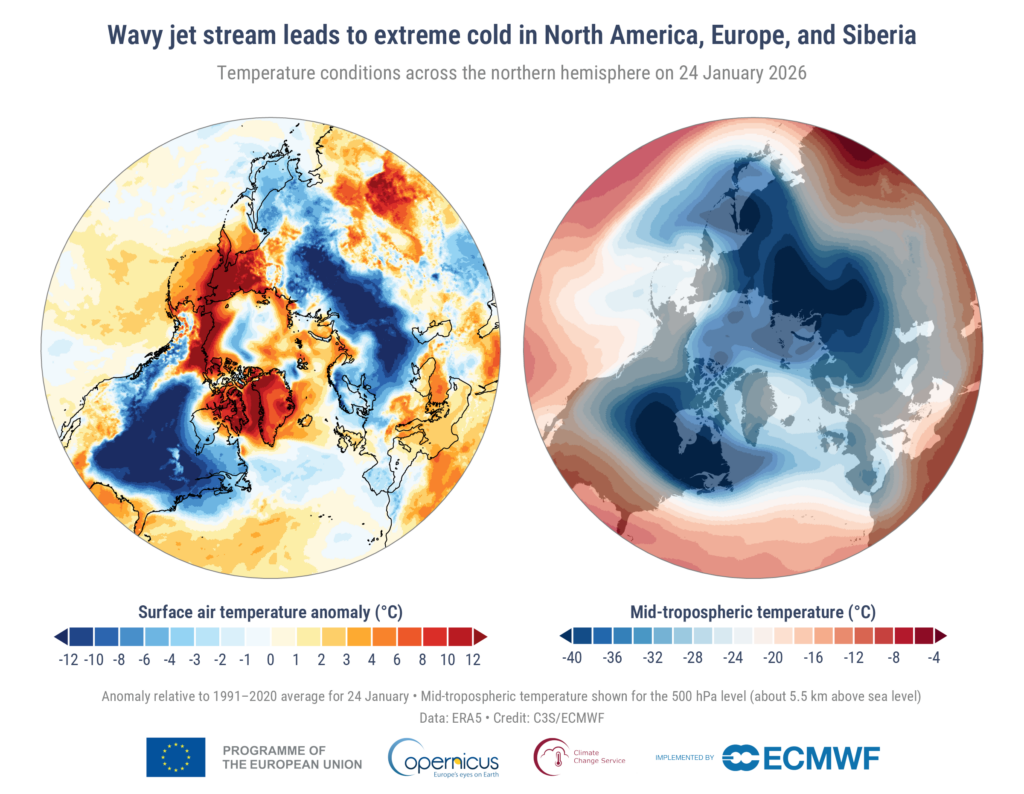
In the final weeks of January, the Northern Hemisphere experienced severe cold waves as a meandering polar jet stream spilled icy air into Europe and North America (as shown in the visual above). This contributed to Europe experiencing its coldest January since 2010, with an average temperature of -2.34 degrees C. Despite these cold episodes, monthly temperatures in January were above average over much of the globe, including in large parts of the Arctic and western North America (as shown in the world map visual below). Further highlights on the cold outbreaks can be found here.
In the Southern Hemisphere, record breaking heat provided fuel for extreme conditions, including wildfires that turned dramatic in the second half of January, as highlighted by The Copernicus Atmosphere Monitoring Service (CAMS). That included intense blazes claiming lives across Australia, Chile and Patagonia. Heavy rains in southern Africa in the final week of the month led to severe flooding, particularly in Mozambique, with a catastrophic impact on lives and livelihoods.

January 2026 – surface air temperature and sea surface temperature highlights
Global temperature
- January 2026 was the fifth-warmest January, globally, with an average surface air temperature of 12.95 degrees C, 0.51 degrees C above the 1991-2020 average for January, according to the ERA5 dataset.
- January 2026 was 0.28 degrees C cooler than the warmest January on record in 2025.
- January 2026 was 1.47 degrees C above the estimated 1850-1900 average used to define the pre-industrial level, according to the ERA5 dataset.
Europe and other regions
- During the second half of January 2026, severe cold conditions affected large parts of the Northern Hemisphere, including North America, Europe and Siberia, mainly driven by a wavier-than-usual polar jet stream that allowed frigid Arctic air to spill into mid-latitudes.
- The average temperature over European land for January 2026 was -2.34 degrees C, 1.63 degrees C below the 1991-2020 average for January, making it the coldest January since 2010.
- Widespread cold conditions occurred across Fennoscandia, the Baltic States, eastern Europe, Siberia, and the central and eastern United States.
- The largest warmer-than-average temperatures occurred across the Arctic, most notably in most of the Canadian Arctic Archipelago, Baffin Bay, Greenland and the Russian Far East. Above-average temperatures were also recorded across southern South America, northern Africa, central Asia, and most of Australia and Antarctica.
Sea surface temperature
- The average sea surface temperature (SST) for January 2026 over 60 degrees S – 60 degrees N was 20.68 degrees C, the fourth-highest value on record for the month, 0.29 degrees C below the January 2024 record.
- A large region of the subtropical and the northeast North Atlantic, including the Norwegian Sea, had the warmest SSTs on record for the time of year.
- Most of the North Pacific continued to experience much above-average SSTs. In contrast, SSTs were close to or below the 1991-2020 average in the central and eastern equatorial Pacific, reflecting weak La Niña conditions.
- The most below-average SSTs were recorded in the Arabian Sea, the Indian Ocean, the central South Pacific Ocean and in the Tasman Sea.
January 2026 – sea ice highlights
- In the Arctic, the average sea ice extent in January was six per cent below average, the third lowest on record for the month.
- Regionally, sea ice concentrations were much below average in the northern Barents Sea, between Svalbard and Franz Josef Land, as well as in Baffin Bay and the Labrador Sea, coinciding with much-above-average surface air temperatures in those regions.
- In the Antarctic, the monthly sea ice extent was eight per cent below average, outside of the 10 lowest extents for the month.
- Sea ice concentrations around Antarctica were above average in the Weddell Sea, but generally below average in other ocean sectors, particularly in the Bellingshausen Sea.
January 2026 – highlights of hydrological variables
- In January 2026, it was wetter than average in much of western, southern and eastern Europe. Heavy precipitation led to flooding and associated damage and disruption in many regions, including the Iberian Peninsula, Italy, the western Balkans, Ireland and the UK.
- Drier-than-average conditions were seen in a large region of central Europe, stretching north-eastward across the Baltic States to Finland and part of western Russia, Scandinavia and Iceland.
- Outside Europe, wetter-than-average regions include western Canada, northern Mexico and southern United States, central Asia, easternmost Russia and Japan, southeastern Brazil, northern Australia and southern Africa. In many regions, heavy rainfall led to floods or disruptions.
- Drier-than-average conditions were seen in the north-western coastal and southern United States, southern parts of China, much of extra-tropical South America and much of southern and western Australia. In Chile, Argentina and Australia, the hot and dry conditions were conducive to wildfires.
The Copernicus Climate Change Service (C3S), implemented by the European Centre for Medium-Range Weather Forecasts on behalf of the European Commission with funding from the EU, routinely publishes monthly climate bulletins reporting on the changes observed in global surface air and sea temperatures, sea ice cover and hydrological variables. Most of the reported findings are based on the ERA5 reanalysis dataset, using billions of measurements from satellites, ships, aircraft and weather stations around the world.